
IceBoost v2 glacier volume estimate puts world total near 150,000 cubic kilometers
A new machine-learning dataset maps glacier thickness worldwide, refining regional estimates while leaving the global ice total broadly unchanged.
By Priya Raghavan · Science Reporter
3 min read
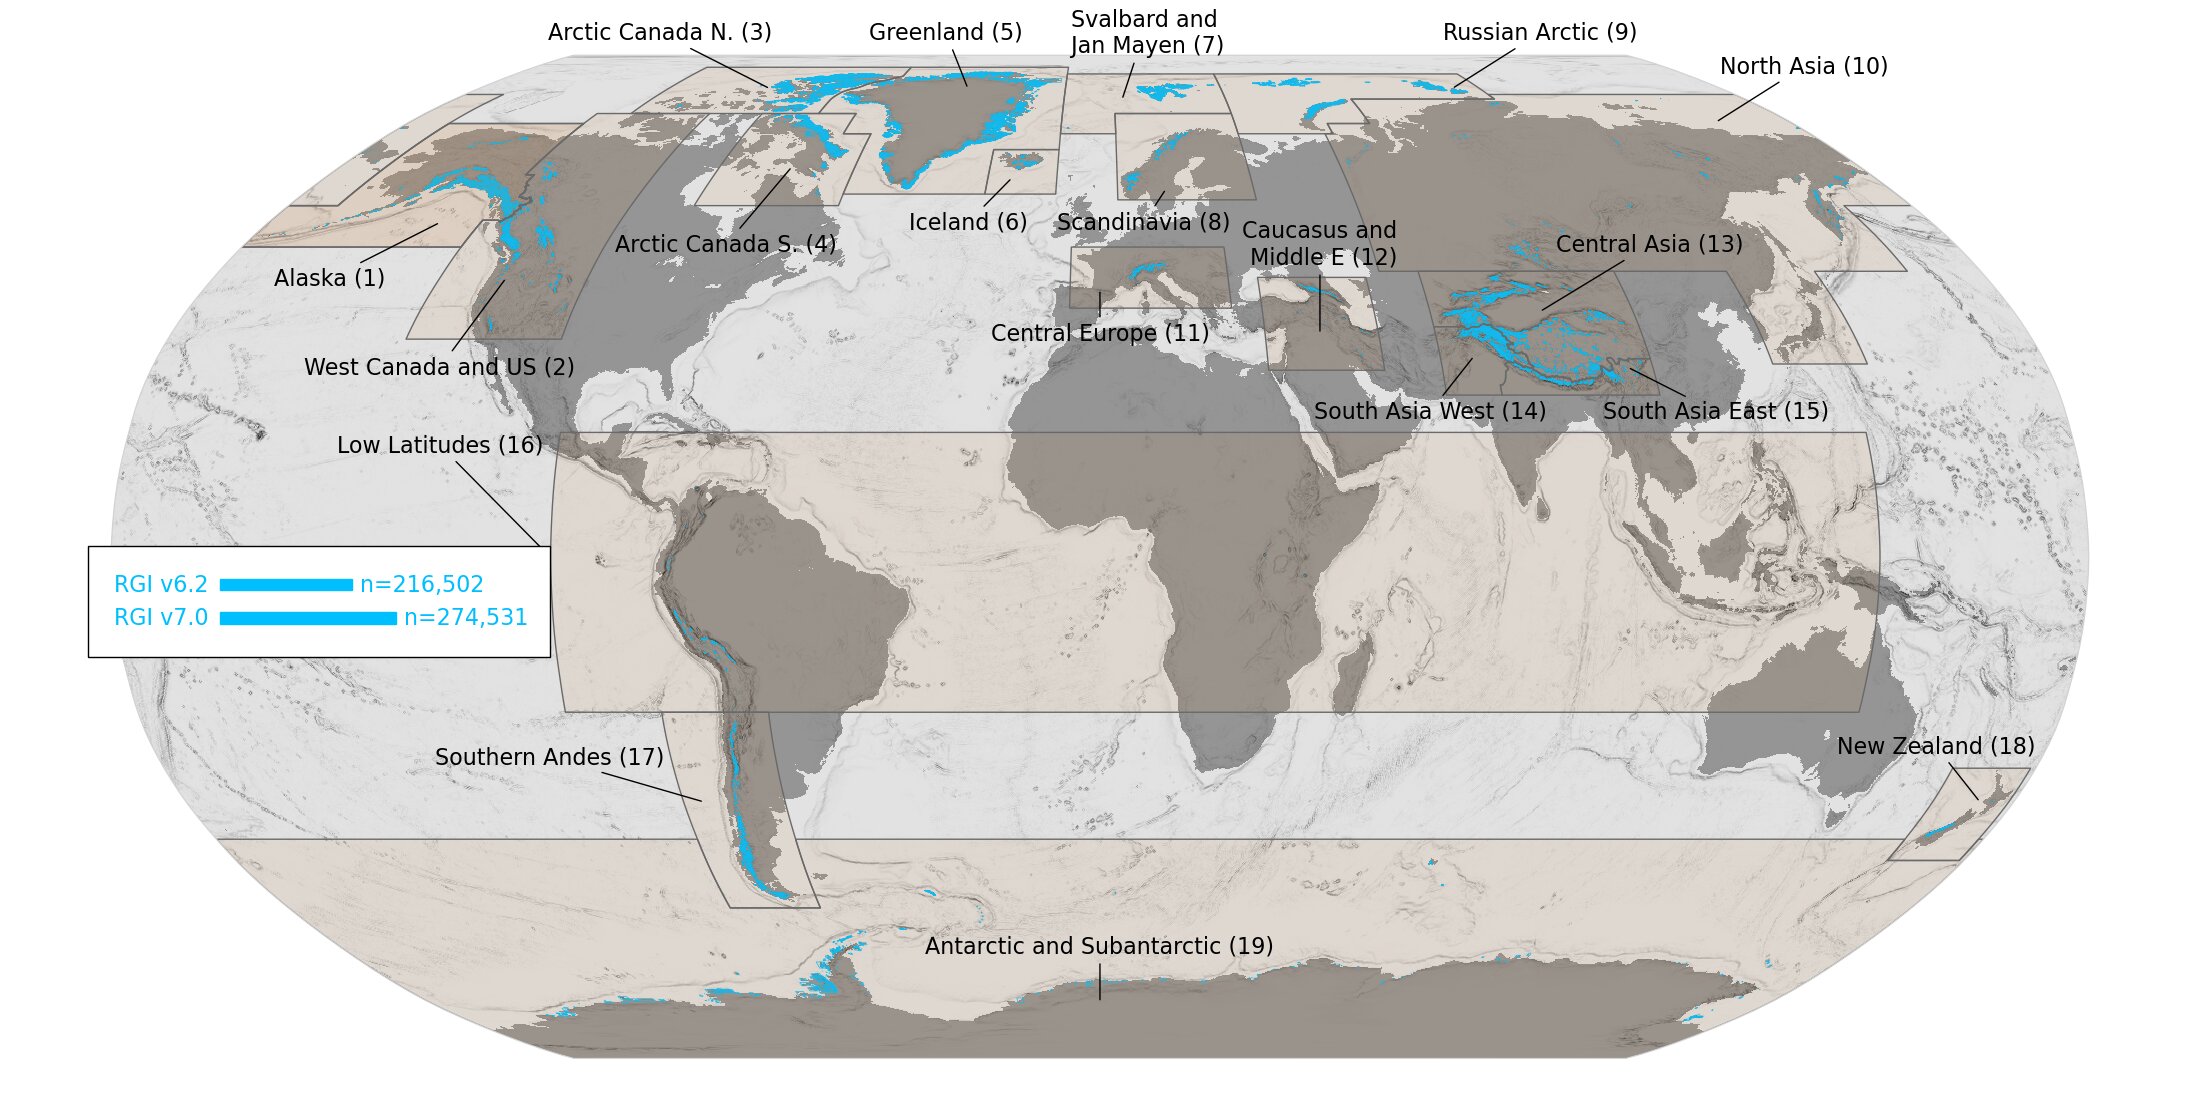
The IceBoost v2 glacier volume estimate puts the world’s glaciers at roughly 150,000 cubic kilometers of ice, a total broadly in line with earlier assessments. The new dataset matters less for changing the worldwide number than for producing a more detailed map of where the ice lies, information researchers can use in projections of glacier change and sea-level rise.
The peer-reviewed study, published in Scientific Data, estimates 149,000 cubic kilometers of glacier ice, with an uncertainty of plus or minus 38,000 cubic kilometers, using the latest Randolph Glacier Inventory release. That amount has a sea-level equivalent of 323 millimeters, plus or minus 91 millimeters, if all of that glacier ice melted. Ca’ Foscari University of Venice said the headline total excludes the Antarctic and Greenland ice sheets.
What does the IceBoost v2 glacier volume study show?
The central result is a glacier-by-glacier reconstruction of ice thickness rather than a sharply higher global estimate. For the older RGI v6.0 inventory, the researchers calculated 150,000 cubic kilometers, plus or minus 38,000 cubic kilometers. The study said that overlaps earlier estimates of 141,000 plus or minus 40,000 cubic kilometers and 158,000 plus or minus 41,000 cubic kilometers.
IceBoost v2.0 estimates thickness across every glacier outline in the RGI v6.0 and v7.0 inventories: 215,547 and 274,531 outlines, respectively. The dataset also covers 955 ice masses connected to the Greenland Ice Sheet, according to the paper.
How did the model estimate glacier ice?
The researchers used a gradient-boosted decision-tree model trained on 7 million thickness measurements. It draws on physical and geometrical predictors; Ca’ Foscari said these include slope, surface curvature, ice velocity and temperature.
The paper says physical laws were not explicitly built into the training process. That makes the quality and coverage of the measurements, elevation data, velocity fields and mapped glacier boundaries important to the resulting maps.
Where is the new map most reliable?
Compared with measurements, IceBoost v2.0 had root mean square errors 20% to 45% lower than other models in the high Arctic, the study found, while its performance was comparable elsewhere. The authors said confidence is greatest at high latitudes, where the training data are more plentiful.
Confidence is lower for small glaciers, steep mountain terrain and lower-latitude areas with fewer observations. The paper also identifies potential downward bias in thickness estimates for low-slope, thick-ice areas when the model inputs are uncertain.
One regional result illustrates why distribution matters. At East Greenland’s Geikie Plateau, the model estimated nearly twice as much ice as previously reported. The authors presented that as a model result that could improve understanding of the bedrock beneath the ice, rather than as a direct measurement.
The released maps can support models of future glacier evolution and sea-level rise, help target field surveys and inform freshwater-management decisions, the study said. Its background summary, citing earlier research, says glaciers have lost about 5% of their mass over the past two decades and account for about 25% to 30% of modern sea-level rise.
This story draws on original reporting from Phys.org.