
Global household wealth 2025 rose by $40 trillion, McKinsey says
McKinsey says households added a record $40 trillion in 2025, with gains driven mainly by equity valuations rather than new capital.
By Hana Yoshida · Markets Reporter
3 min read
Global household wealth 2025 increased by a record $40 trillion, lifting household net worth to $570 trillion, according to the McKinsey Global Institute. The institute said the 7.3% rise exceeded the average annual growth rate of 5.9% recorded since 2000 and came as the global balance sheet of assets approached $1.8 quadrillion.
McKinsey’s newly released “Global Balance Sheet 2026: Imbalance and Divergence” report said the world’s balance sheet is now more than four times its 2000 level when measured in nominal terms at market exchange rates. The institute said that growth has outpaced GDP, raising questions about the stability of wealth gains that are increasingly separated from underlying economic output.
Why did global household wealth rise in 2025?
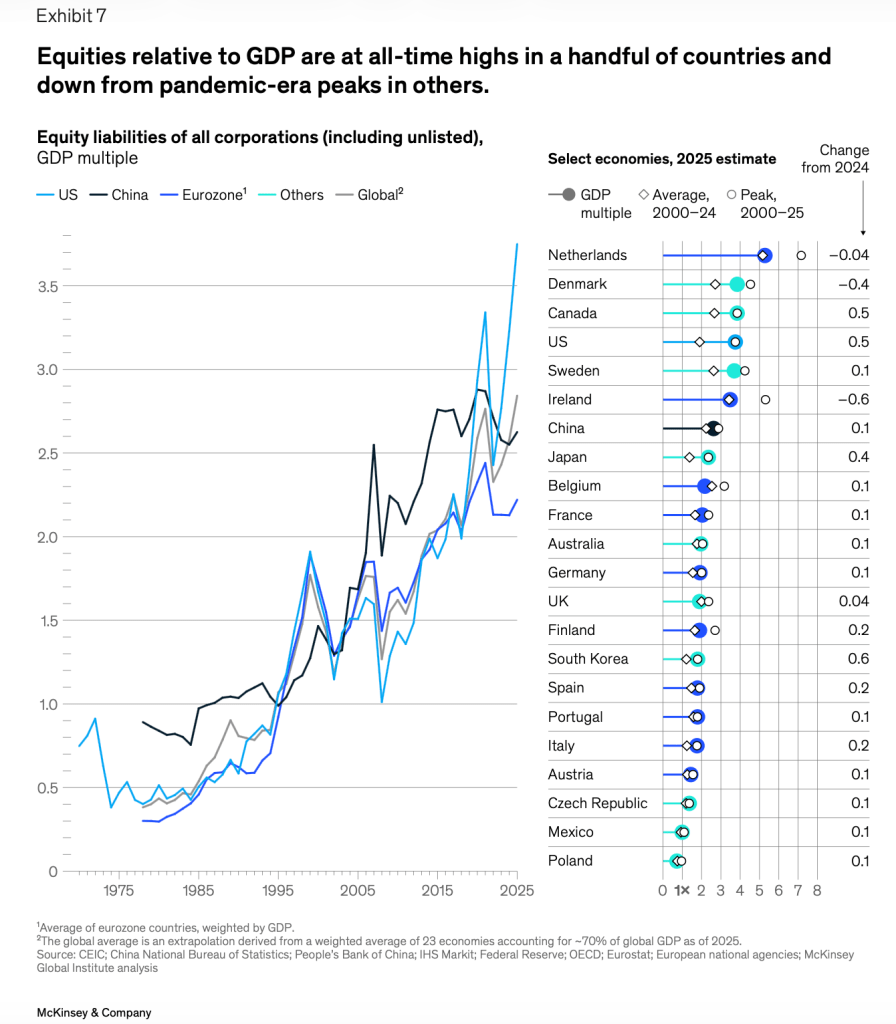
McKinsey attributed much of the latest increase to rising asset prices, especially equities, rather than to investment in new productive capacity. The report said only about 20% of the added household wealth came from real capital formation, while equities made up 57% of the increase and real estate accounted for 15%.
That mix marked a change from the pattern McKinsey identified between 2000 and 2024, when real estate provided most household wealth gains. Real estate remains the largest component of household wealth in many economies, and McKinsey said slower property-value growth has kept per-capita wealth from matching GDP growth in much of the world.
“Paper” wealth refers to gains in the market value of assets such as stocks or property, rather than wealth created through new factories, equipment, infrastructure or other productive investment. Those gains can make balance sheets look stronger, but they depend on asset prices holding up.
How the United States and China differ
The report described sharply different drivers in the world’s two largest economies. In the United States, McKinsey said wealth growth leaned on higher equity valuations, with U.S. equity values reaching 2.4 times corporate net assets in 2025, nearly twice the historical average.
McKinsey said a little more than half of the S&P 500’s market-capitalization growth from 2021 through 2025 came from the “Magnificent Seven,” a group of large technology companies tied to artificial intelligence. The institute also said the United States now represents almost half of corporate equity value among major economies, after increasing its share substantially over the past 15 years.
In China, McKinsey pointed to debt as the main force behind balance-sheet growth. The report said Chinese corporate debt reached 80% of real assets, compared with a global norm of 50%, and equaled 1.7 times GDP. At the same time, falling property values weighed on Chinese household wealth, according to the institute.
The report said household wealth per person is rising in most countries, though not evenly. McKinsey identified the United States and Australia as having the highest wealth per capita, and said both recorded household-wealth gains of at least 20 percentage points of GDP.
What could happen next?
McKinsey told executives that a balance sheet out of line with the real economy can adjust through higher productivity, higher inflation or lower asset prices. It also said swollen balance sheets can persist under conditions resembling secular stagnation, delaying a possible correction.
The institute said each of those outcomes remains possible for major economies. Its warning centers on the gap between the market value of global assets and the slower growth of the real economy that supports them.
This story draws on original reporting from Fortune.